Building a usage-based billing system#
Authored by Drew Kim Sicheng Pan Hammad Bashir Sanket Kedia Philip Thomas
Authored by Drew Kim Sicheng Pan Hammad Bashir Sanket Kedia Philip Thomas
Usage-based billing enables us to offer a genuine "pay for what you use" model, which aligns with the value we deliver to customers. Our approach isn't just about simplifying billing - it's designed around three core customer needs:
At Chroma, we implement a usage-based billing system that tracks three key metrics: reads, writes, and storage. Specifically, we bill based on:
Our pricing structure is directly tied to our actual infrastructure costs, ensuring transparency and fairness. For each customer request, we can trace its path through our system and calculate our costs, which informs our pricing.
Importantly, our approach adheres to key principles: consistent pricing across similar requests, predictable costs that customers can calculate before sending requests, and a model that's intuitively understandable - building trust and ensuring incentive alignment between our business and our customers' success.
Our billing infrastructure consists of two primary components:
As a database designed for massive scale in the number of collections a customer may store, Chroma needs a system that can:
Our approach centers on producing a continuous stream of "events" containing metadata that can determine customer usage over time. Each event captures a specific billable action within our system, recording who used what resources, when, and how much. Here's an example of our usage event schema:
With a stream of events, we can calculate usage through aggregations like SUM(active_seconds * size_bytes) to determine total byte-seconds of storage consumed by a customer. Our goal is to produce such events based on system events and land them in object storage to be used for downstream billing computations.
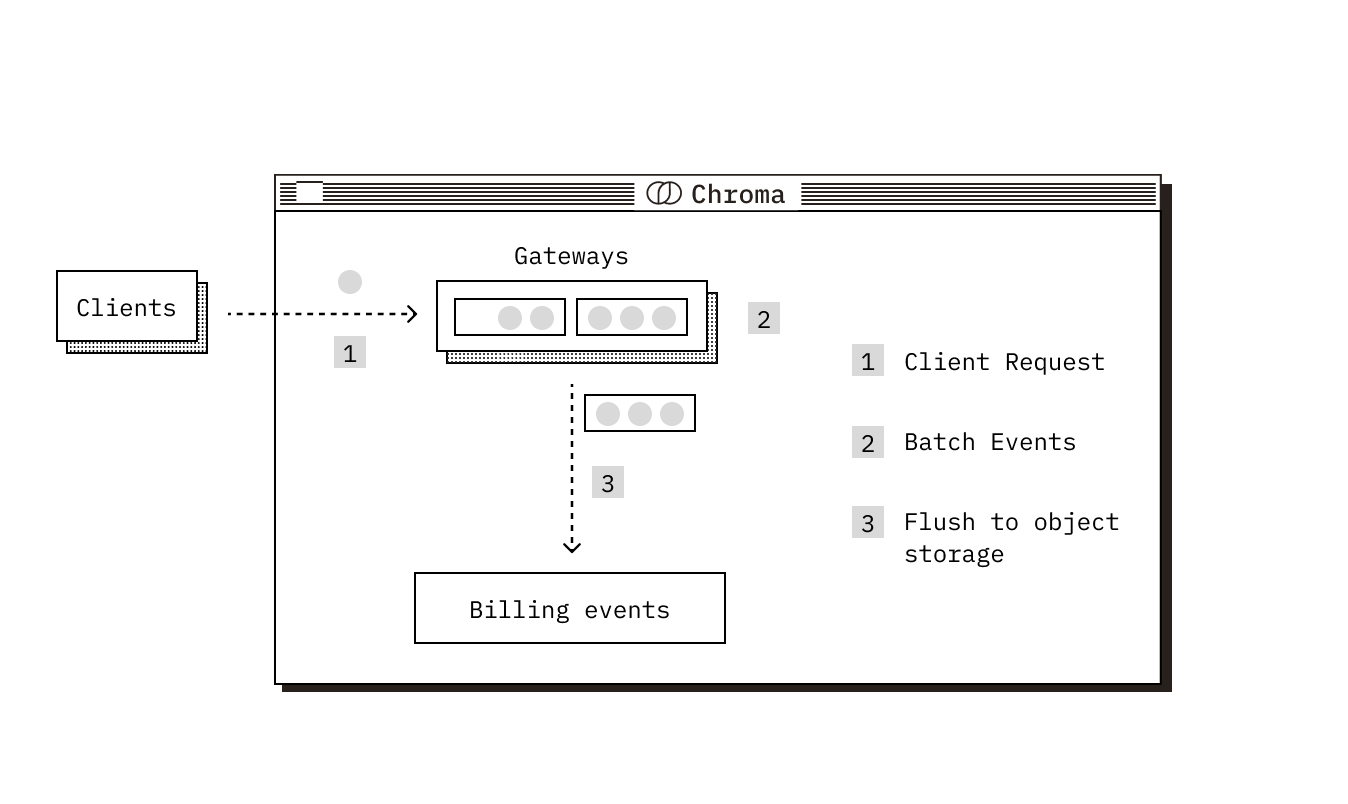
Tracking reads and writes happens at the API layer, where we record metadata for each request:
This data is buffered in memory and aggregated per tenant (in order to reduce object storage ingress/egress costs). Approximately every minute, each node flushes its buffered batch of aggregated events to object storage.
Metering storage presents a more complex challenge due to the scale and dynamics of our system. Chroma uses a few terminologies that are helpful to understand:
To understand our approach, it's important to grasp Chroma's scale:
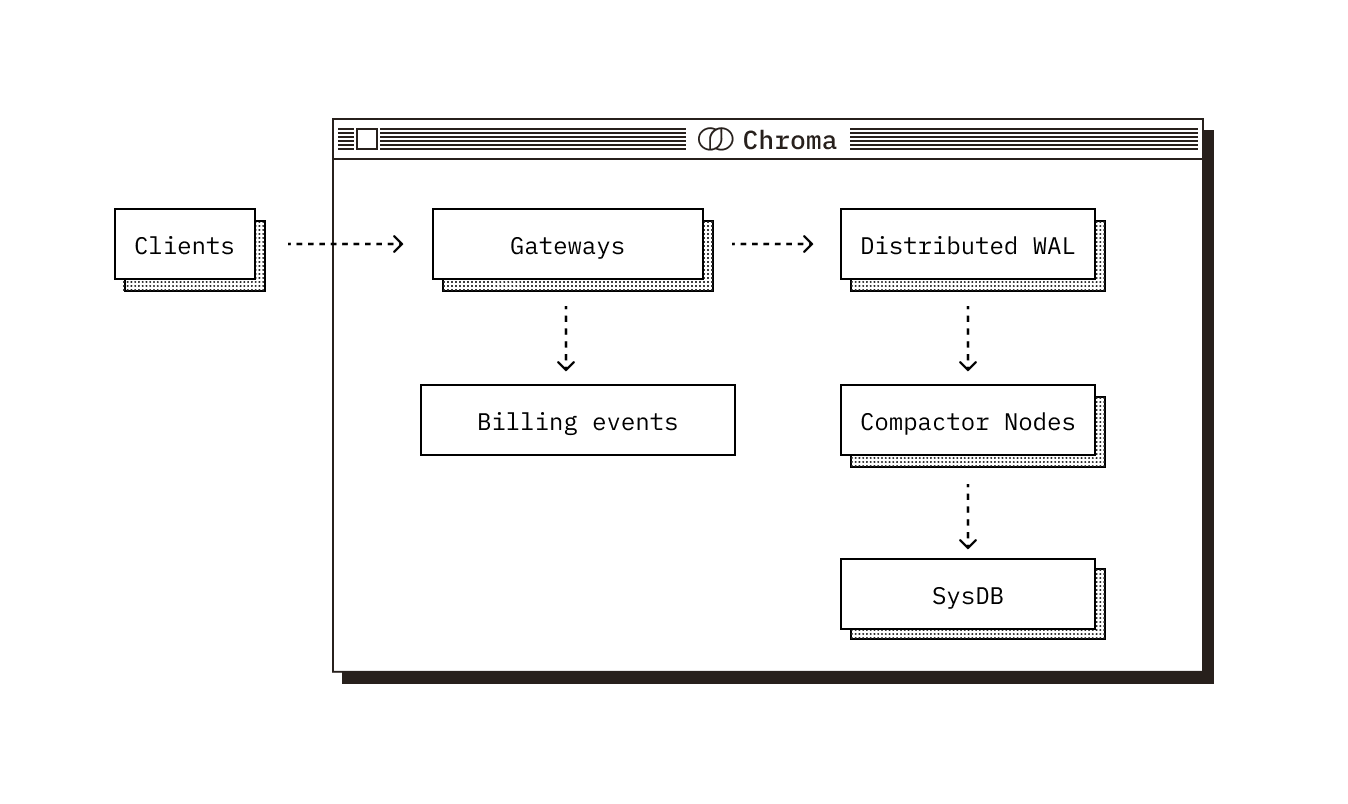
On our write path, each write is durably recorded in a log. Several times per minute, a compactor node processes batches of writes from this log, updates object storage, and completes transactions by updating collection metadata in our metadata store (SysDB). The SysDB contains crucial information like size, name, and ownership of each collection.
One might assume we could simply query the SysDB periodically with something like SELECT SUM(size) FROM collections GROUP BY tenant to calculate the total storage used by each customer. We could generate JSON event payloads from these results and flush them to object storage. This approach fails for two critical reasons.
First, it doesn’t provide accurate measurements unless we use a high sampling rate. According to the Nyquist-Shannon sampling theorem, we need to sample at double the rate at which collections change to build an accurate picture of the signal. Since compactions happen with a maximum frequency of once a minute, we need to sample each collection approximately every 30 seconds—an infeasible approach given our scale.
Second, performing full table scans over billions of rows multiple times per minute on a database that's in the critical path of our product creates an unacceptable bottleneck, impacting performance for our core service. We could implement a read replica on the SysDB, but it still doesn’t solve our heartbeat problem.
We can't perform a sampling approach, which leaves only one other option: respond to updates to collections as they happen. With this in mind, consider a scenario where a collection is written to once and never again. If we only emit usage events based on collection updates, we never generate another event for that collection—despite it still occupying storage and incurring costs.
To handle this, we could interpolate collection sizes—assume unchanged size until notified otherwise. While simpler, this approach introduces issues with data granularity and accuracy, as it generally requires usage events to represent deltas (size changes) rather than absolute values. Delta-based events create two significant problems:
These limitations necessitate a heartbeat approach—emitting a consistent (hourly) stream of usage events per collection that represent their size changes.
Since the SysDB represents our source of truth for collection sizes and updates to it mark the completion of writes, we can't avoid using it entirely. Our solution employs change data capture (CDC) to read changes from our Postgres SysDB's write-ahead log (WAL) and replicate them to a stream. This efficiently captures all collection changes and allows us to replay and process the log of events in order without affecting SysDB performance. An example update payload produced by CDC looks like:
A simple approach would be to, on receipt of a new payload, calculate the differences in commit timestamps of the previous entry and the updated entry, and use this with the collection size to generate a usage event (how much storage for how much time). The issue is that this solution by itself doesn't enable a heartbeat mechanism. Periodic heartbeats for billions of collections would still require full table scans of the SysDB.
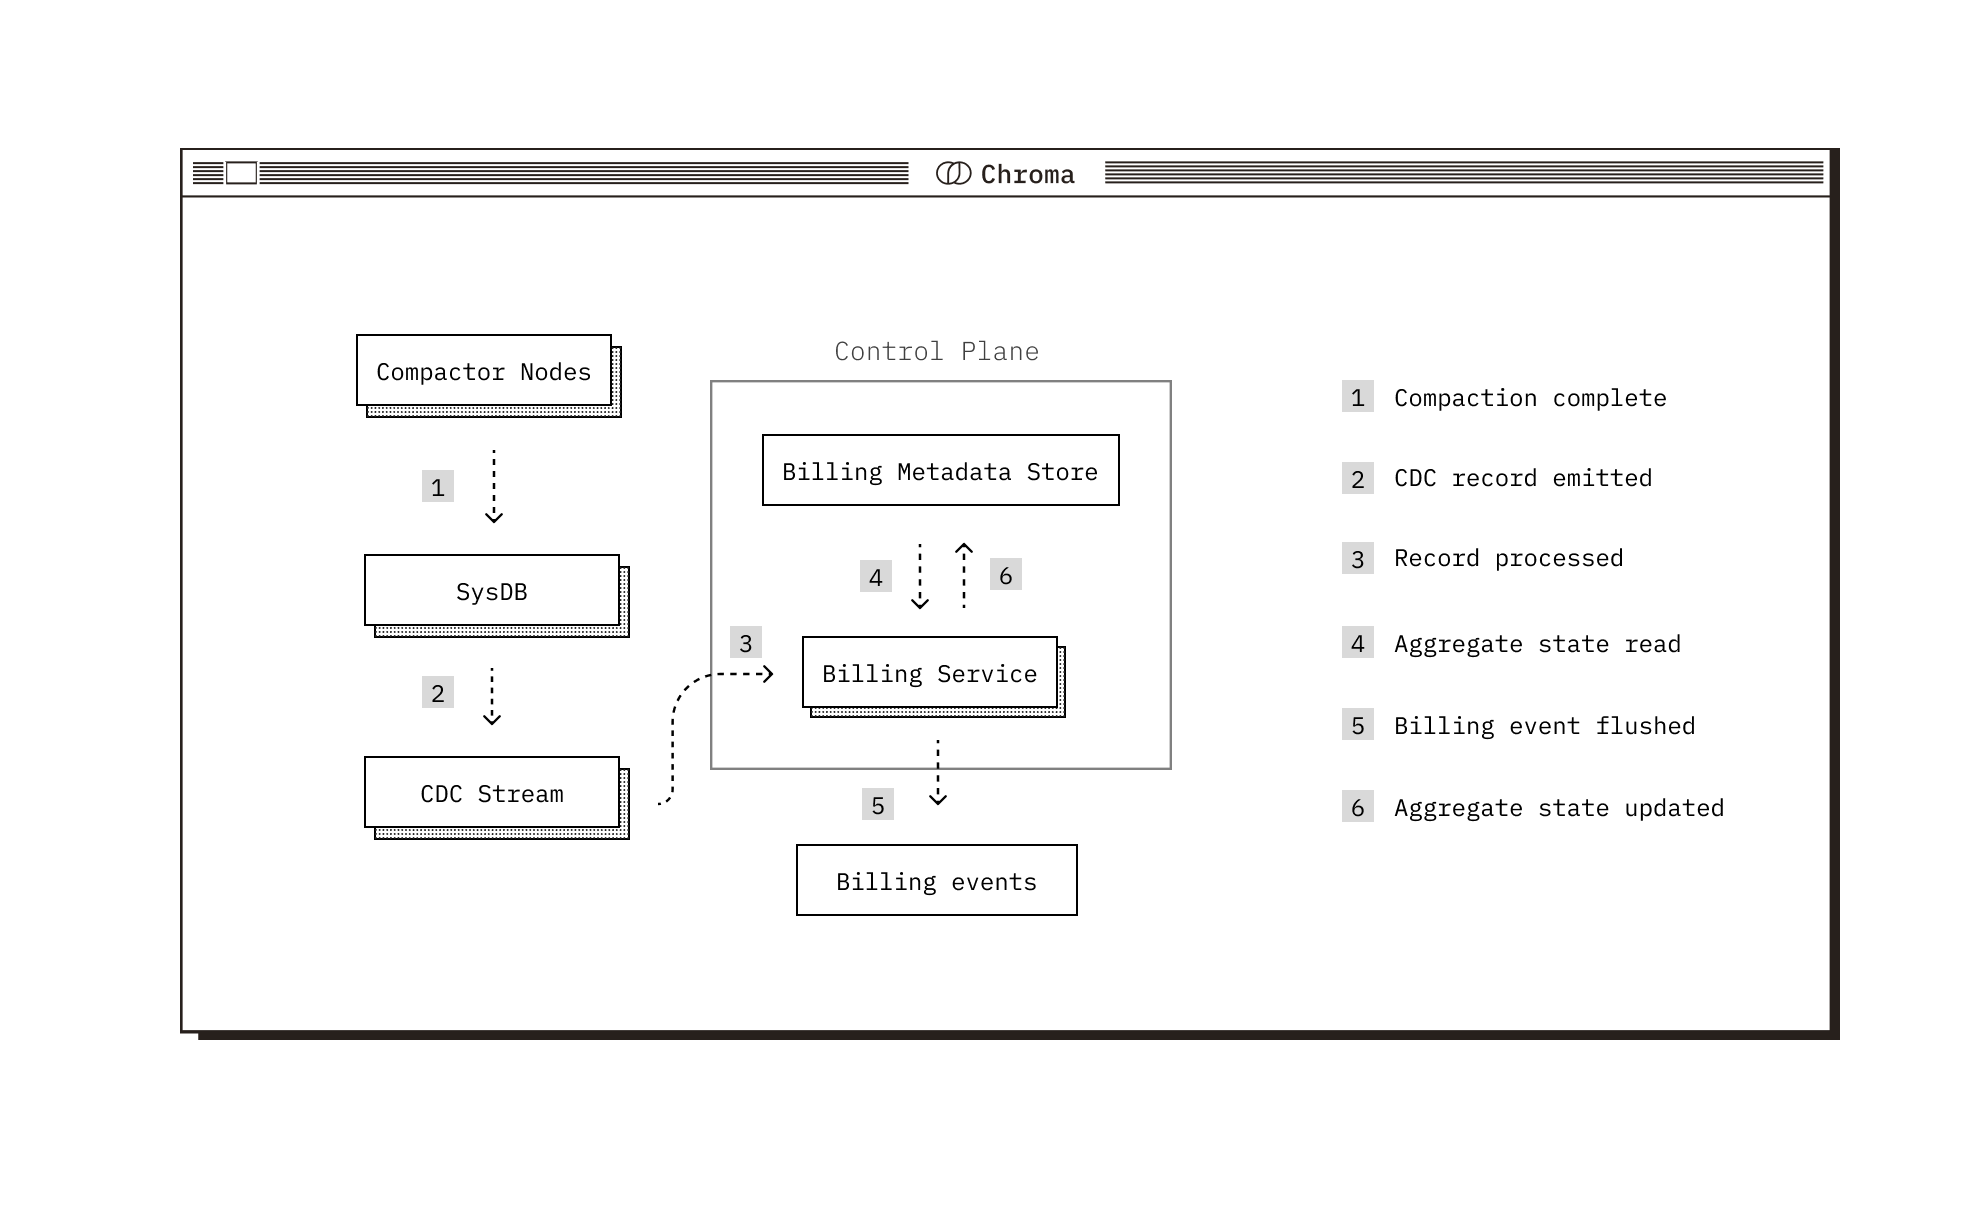
Thus, we use a database-level metadata store. Instead of generating usage events per collection directly from the output of the stream and sending them to object storage, we aggregate them into a persisted state per database. Rather than tracking on the order of 10B+ collections individually, this lets us track on the order of 100K databases. The database-level store tracks:
For each record we read off the stream, we pull the collection’s corresponding database state and use it in conjunction with the record data to calculate the amount of storage used and for how long. We then emit a usage event to object storage and update the database state with the new size, event emit time, and record log position.
This enables us to design a heartbeat mechanism that runs hourly. On each run, it queries the metadata store for each database and enqueues a special heartbeat record per database to our ordered stream. When our processing service encounters these heartbeat records, it pulls the database state and emits a usage event with the current size of the database. By using the database-level store, we keep this full table scan efficient and by enqueuing records onto our stream, we ensure heartbeats get processed in order with other updates.
In a system with many moving parts where it’s important to get things right (we don’t want to over or under bill our customers), there are a few methods we employ to ensure correctness.
For example, we modify the effective heartbeat time to lag behind its enqueue time on the stream in order to account for the SysDB replication lag and allow all the records to make it onto the stream. Because there is some delay between when commits land on the SysDB and when they land on our stream, if we processed heartbeats by their enqueue time on the stream, there would be a chance that we would process them before all updates for the corresponding database landed on the stream. Our approach ensures correctness by guaranteeing that heartbeats are processed in order.
Along these lines, heartbeat records are ignored if there is a processed collection update event whose timestamp is after the given heartbeat’s. Recall that we heartbeat to fill potential gaps in our data from no collection updates. If there is an update, it precludes the need for a heartbeat.
We ensure idempotency when processing CDC records by comparing the SysDB WAL position of the record to the position of the last processed record in the metadata store. If the WAL position of the current record is before what is stored, we ignore it. This allows us to arbitrarily replay events in the case of disaster recovery. We need to use a monotonically increasing counter instead of commit timestamps to establish ordering, since two commits can land at the same time.
We also ensure idempotency for any downstream event processor. For each usage event, we generate an idempotency key that is a hash of the corresponding database UUID and commit timestamp of the update. Thus, in the event of a disaster where our billing metadata store gets wiped, we can reprocess the stream without worrying about duplicate events because the generated idempotency key will remain the same.
Within our stream, we have multiple shards and ordering guarantees only apply per shard. Thus, we shard the CDC records by database UUID to guarantee that updates to the same database are processed in order by the billing service. This ensures correctness, as in-order processing of updates per database is a key invariant of our system. Currently there is a singular replica of the billing service, but we could create a replica per shard to scale out the system.
Generating usage events provides the raw data needed to determine customer system utilization, but transforming this into invoices, collecting payments, and managing pricing plans requires complex business logic. Rather than building and maintaining this ourselves, we partner with Orb) to handle these aspects.
Our usage events land in object storage, where Orb ingests them for processing. Orb provides:
Creating pricing plans in Orb simply requires defining an aggregation over specific properties in our usage events and applying unit prices. This flexibility allows us to evolve our pricing model without modifying our core ingestion pipeline.
By partnering with Orb, we eliminate complexity in building and maintaining our usage-based billing system. This strategic decision accelerates our time to market and allows us to focus on delivering core value to our customers.
Building a scalable, accurate usage-based billing system for a database requires careful architectural decisions. By separating metering from billing logic, employing change data capture, and implementing strategic aggregation, we create a robust system that accurately tracks and bills for system usage while maintaining performance. This approach enables us to offer transparent, fair pricing that aligns with both our costs and the value we deliver to customers.